2 May 2009

Q3. How can you get your site listed at major search sites: and how could you improve your site ranking?

Answer:

I use yahoo.com search engine as an example to have my website listed.
First of all, I need to go to the webpage of Yahoo! Small Business at http://sem.smallbusiness.yahoo.com/searchenginemarketing/#. In this webpage, I need to click "Sign Up" button to register my website (see Diagram-81 for reference).

Diagram-81 - Sign Up

After clicking "Sign Up", I need to select "Target Customers by Geographic Location" in the pull down menu. The menu is on the left of the webpage. I select "Hong Kong" as my Geographic Location (see Diagram-82 for reference) and then click "Get Started" to go to Next Step.


Diagram-82 - My Geographical Location

After Clicking "Get Started" button, I need to tell Yahoo! where is my target market place, for example, I can choose the entire market (whole world) or Area (just Hong Kong). The Diagram-83 show the step to select target market geographically. Hence, I select "entire market" for my business.

Diagram-83 - My target market

After selecting the target market, I need to click "Next:Keyboards>" to go to next step. The Diagram-84 is the screen dump to describe the keywords. I key in the Keywords which is related to my Business, for example, entering words or phrases related to the products and services my business provides. The better keywords describe, the higher ranking of my website obtains. If my website or product is about HDTV, I may put HDTV, LCD TV and Joseph Brand HDTV in the keyword field (see Diagram-84).
Diagram-84 - Entering Keywords for my products or services

In Diagram84, I click "Next:Pricing>" button to go to next step after I have finished to enter products' or services' keywords. The next step is to enter budget for the ad. The diagram-85 shows the screen dump in which Yahoo! asks me to enter the amount for "Account Daily Spending Limit" and the amount for "Your Maximum Bid". After entering the amounts, click "Next:Create Ad >" to continue.
Diagram-85 - The expense for the Ad.

The "Next:Create Ad>" button brings us to the next step. The step - "4. Create Your Ad" in Diagram-86 requires me to enter Title, Description and URL of my website. I put the values "MyTV", "Very Good TV", "http://www.josephtv.com/ to Title, Description and URL respectively. After that, I can click "Next:Review>" to the next step.
Diagram-86 - Create the Ad

In Diagram-87, after filling in the required information, I can click "Activate Now" button to complete the process. After all, I can get my website listed at the major search site like yahoo.com


Diagram-87 - Activation

In order to improve my site ranking, we have 2 choices. Firstly, I can add more precise keywords for my website like the keywords in Diagram-84. Or I can put the good and precise keywords description in my website's index.html page. The keywords are added between head tags and within meta tags. The keywords are added to meta tags as attribute. The more precise keywords is added, the higher website ranking is got. The search engines seek things using meta tags keywords, therefore a better keywords' description gains higher ranking.

Q2. What is a Meta-Search Engine? Provide some examples.

Answer:

A meta-search engine is a search tool that sends user requests to several other search engines and/or databases and aggregates the results into a single list or displays them according to their source. Metasearch engines enable users to enter search criteria once and access several
search engines simultaneously. Metasearch engines operate on the premise that the Web is too large for any one search engine to index it all and that more comprehensive search results can be obtained by combining the results from several search engines. This also may save the user from having to use multiple search engines separately.
The term Metasearch is frequently used to classify a set of commercial search engines, but is also used to describe the paradigm of searching multiple data sources in real time. The National Information Standards Organization (NISO) uses the terms Federated Search and Metasearch interchangeably to describe this web search paradigm. (Wikipedia, 2009)
The examples of the meta-search engines are listed below...
  1. Clusty - http://clusty.com/
  2. Dogpile - http://www.dogpile.com/
  3. Excit - http://www.excit.com/
  4. HotBot - http://www.hotbot.com/
  5. Info.com - http://www.info.com/
(Wikipedia, 2009)

Reference:

1. Wikipedia (2009). "Metasearch Engine". Wikipedia The Free Encyclopedia, Retrieved from URL - http://en.wikipedia.org/wiki/Meta-search_engine


Q1. What is a Spider? What does it do?

Exercise 23: Searching Mechanisms

Q1. What is a Spider? What does it do?

Answer:

Spider is a program that automatically fetches Web pages. Spiders are used to feed pages to search engines. It's called a spider because it crawls over the Web. Another term for these programs is webcrawler.
Because most Web pages contain links to other pages, a spider can start almost anywhere. As soon as it sees a link to another page, it goes off and fetches it. Large search engines, like Alta Vista, have many spiders working in parallel. (Webopedia, 2009)

A web crawler (also known as web spider) is a program which browses the World Wide Web in a methodical, automated manner. A web crawler is one type of webbot. Web crawlers not only keep a copy of all the visited pages for later processing - for example by a search engine but also index these pages to make the search narrower.
In general, the web crawler starts with a list of URLs to visit. As it visits these URLs, it identifies all the links in the page and adds them to the list of URLs to visit. The process is either ended manually, or after a certain number of links have been followed.
Web crawlers typically take great care to spread their visits to a particular site over a period of time, because they access many more pages than the normal (human) user and therefore can make the site appear slow to the other users if they access the same site repeatedly.
For similar reasons, web crawlers are supposed to obey the robots.txt protocol, with which web site owners can indicate which pages should not be spidered. (Knowledgerush, 2003)

Reference:

1. Webopedia (2009). "What is Spider?". The #1 Online Encyclopedia dedicated to computer technology, Retrieved from URL - http://www.webopedia.com/TERM/s/spider.html
2. Knowledgerush (2003). "Web Spider". Knowledgerush.com, Retrieved from URL - http://www.knowledgerush.com/kr/encyclopedia/Web_spider/


Exercise 21: Shopping Cart Specifications

Develop the Class Diagram for the following shopping cart specifications:

A shoppingCart object is associated with only one creditCard and customer and to items in itemToBuy object. Persistent customer information such as name, billing address, delivery address, email address, and credit rating is stored in the customer object. The credit card object is associated with a frequentShopper discount object, if the credit rating for the customer is good. The customer can make or cancel orders as well as add and delete items to the shopping cart product. The creditCard object contains the secure method for checking that the charge is authentic.

Answer:

The Class Diagram has been drawn and is shown in Diagram-80.
Diagram-80 - Class Diagram of ShoppingCart


Exercise 22: Differentiate between software systems.....

Q. Differentiate between software systems such as Customer Relationship Management (CRM) software, Business-to-Business e-commerce programs and Supply-Chain Management (SCM) software.

Answer:

Customer Relationship Management (CRM)
is an information industry term for methodologies, software, and usually Internet capabilities that help an enterprise manage customer relationships in an organized way. For example, an enterprise might build a database about its customers that described relationships in sufficient detail so that management, salespeople, people providing service, and perhaps the customer directly could access information, match customer needs with product plans and offerings, remind customers of service requirements, know what other products a customer had purchased, and so forth.
According to one industry view, CRM consists of:
  • Helping an enterprise to enable its marketing departments to identify and target their best customers, manage marketing campaigns and generate quality leads for the sales team.
  • Assisting the organization to improve telesales, account, and sales management by optimizing information shared by multiple employees, and streamlining existing processes (for example, taking orders using mobile devices)
  • Allowing the formation of individualized relationships with customers, with the aim of improving customer satisfaction and maximizing profits; identifying the most profitable customers and providing them the highest level of service.
  • Providing employees with the information and processes necessary to know their customers, understand and identify customer needs and effectively build relationships between the company, its customer base, and distribution partners.
Many organizations turn to CRM software to help them manage their customer relationships. CRM technology is offered on-premise, on-demand or through Software as a Service (SaaS) CRM, depending on the vendor. Recently, mobile CRM and the open source CRM software model have also become more popular. (Whatis.com, 2008)

Supply chain management (SCM)
is the combination of art and science that goes into improving the way your company finds the raw components it needs to make a product or service and deliver it to customers. The five basic components of SCM is Plan, Source, Make, Deliver, and Return.
Supply chain management software is possibly the most fractured group of software applications on the planet. Each of the five basic components of SCM previously outlined is comprised of dozens of specific tasks, many of which have their own specific software. Some vendors have assembled many of these different chunks of software together under a single roof, but no one has a complete package that is right for every company. For example, most companies need to track demand, supply, manufacturing status, logistics (i.e. where things are in the supply chain), and distribution. They also need to share data with supply chain partners at an ever increasing rate. While products from large ERP vendors like SAP's Advanced Planner and Optimizer (APO) can perform many or all of these tasks, because each industry's supply chain has a unique set of challenges, many companies decide to go with targeted best of breed products instead, even if some integration is an inevitable consequence. (CIO, 2009)

On the Internet, B2B (business-to-business), also known as e-biz, is the exchange of products, services, or information between businesses rather than between businesses and consumers. Although early interest centered on the growth of retailing on the Internet (sometimes called e-tailing), forecasts are that B2B revenue will far exceed business-to-consumers (B2C) revenue in the near future.
B2B Web sites can be sorted into:
  • Company Web sites, since the target audience for many company Web sites is other companies and their employees. Company sites can be thought of as round-the-clock mini-trade exhibits. Sometimes a company Web site serves as the entrance to an exclusive extranet available only to customers or registered site users. Some company Web sites sell directly from the site, effectively e-tailing to other businesses.
  • Product supply and procurement exchanges, where a company purchasing agent can shop for supplies from vendors, request proposals, and, in some cases, bid to make a purchase at a desired price. Sometimes referred to as e-procurement sites, some serve a range of industries and others focus on a niche market.
  • Specialized or vertical industry portals which provide a "subWeb" of information, product listings, discussion groups, and other features. These vertical portal sites have a broader purpose than the procurement sites (although they may also support buying and selling).
  • Brokering sites that act as an intermediary between someone wanting a product or service and potential providers. Equipment leasing is an example.
  • Information sites (sometimes known as infomediary), which provide information about a particular industry for its companies and their employees. These include specialized search sites and trade and industry standards organization sites.
Many B2B sites may seem to fall into more than one of these groups. Models for B2B sites arDte still evolving.
Another type of B2B enterprise is software for building B2B Web sites, including site building tools and templates, database, and methodologies as well as transaction software.
B2B is e-commerce between businesses. An earlier and much more limited kind of online B2B prior to the Internet was Electronic Data Interchange (EDI), which is still widely used.
(Jones, 2001)

Simply put, CRM software focuses on the customer's relationship when SCM software concentrates on finding raws materials and how the raws materials flow. The B2B E-commerce programs like Electronic Data Interchange (EDI) are used to transfer cash flow, information... etc amongst Businesses.

Reference:

1. Whatis.com (2008). "What is CRM?". TechTarget The IT Media ROI Expers, Retrieved from URL - http://searchcrm.techtarget.com/sDefinition/0,,sid11_gci213567,00.html
2. CIO (2009). "Supply Chain Management Definition and Solutions". CIO.com - Business Technology Leadership, Retrieved from URL - http://www.cio.com/article/40940/Supply_Chain_Management_Definition_and_Solutions
3. Jones Paula (2001). "What is B2B?". TechTarget The IT Media ROI Expers, Retrieved from URL - http://searchcio.techtarget.com/sDefinition/0,,sid182_gci214411,00.html

30 Apr 2009

Exercise 20: Modeling with UML

UseCase, Class, Sequence, Collaboration, State Chart, Activity, Component, and Deployment Diagrams are used in UML. Describe each of the eight (8) main diagrams used in UML.

Answer:

Use Case Diagrams
depict:
  • Use cases. A use case describes a sequence of actions that provide something of measurable value to an actor and is drawn as a horizontal ellipse.
  • Actors. An actor is a person, organization, or external system that plays a role in one or more interactions with your system. Actors are drawn as stick figures.
  • Associations. Associations between actors and use cases are indicated in use case diagrams by solid lines. An association exists whenever an actor is involved with an interaction described by a use case. Associations are modeled as lines connecting use cases and actors to one another, with an optional arrowhead on one end of the line. The arrowhead is often used to indicating the direction of the initial invocation of the relationship or to indicate the primary actor within the use case. The arrowheads are typically confused with data flow and as a result I avoid their use.
  • System boundary boxes (optional). You can draw a rectangle around the use cases, called the system boundary box, to indicates the scope of your system. Anything within the box represents functionality that is in scope and anything outside the box is not. System boundary boxes are rarely used, although on occasion I have used them to identify which use cases will be delivered in each major release of a system. Figure 2 shows how this could be done.
  • Packages (optional). Packages are UML constructs that enable you to organize model elements (such as use cases) into groups. Packages are depicted as file folders and can be used on any of the UML diagrams, including both use case diagrams and class diagrams. I use packages only when my diagrams become unwieldy, which generally implies they cannot be printed on a single page, to organize a large diagram into smaller ones. Figure 3 depicts how Figure 1 could be reorganized with packages.
(Ambler-1, 2006)

The diagram-77 is extracted from http://www.agilemodeling.com/artifacts/useCaseDiagram.htm to show System Use Case Diagram.
Diagram-77 - System Use Case Diagram


In software engineering, a Class Diagram in the Unified Modeling Language (UML), is a type of static structure diagram that describes the structure of a system by showing the system's classes, their attributes, and the relationships between the classes. (Wikipedia-1, 2009)
UML 2 class diagrams are the mainstay of object-oriented analysis and design. UML 2 class diagrams show the classes of the system, their interrelationships (including inheritance, aggregation, and association), and the operations and attributes of the classes. Class diagrams are used for a wide variety of purposes, including both conceptual/domain modeling and detailed design modeling. Although I prefer to create class diagrams on whiteboards because simple tools are more inclusive most of the diagrams that I’ll show in this article are drawn using a software-based drawing tool so you may see the exact notation. (Ambler-2, 2006)

The diagram-78 is extract from http://en.wikipedia.org/wiki/Class_diagram to show an example of Class Diagram.
Diagram-78 - Class Diagram


UML Sequence Diagrams model the flow of logic within your system in a visual manner, enabling you both to document and validate your logic, and are commonly used for both analysis and design purposes. Sequence diagrams are the most popular UML artifact for dynamic modeling, which focuses on identifying the behavior within your system. Other dynamic modeling techniques include activity diagramming, communication diagramming, timing diagramming, and interaction overview diagramming. Sequence diagrams, along with class diagrams and physical data models are in my opinion the most important design-level models for modern business application development. (Ambler-3, 2006)
A sequence diagram in Unified Modelling Language (UML) is a kind of interaction diagram that shows how processes operate with one another and in what order. It is a construct of a Message Sequence Chart. Sequence diagrams are sometimes called Event-trace diagrams, event scenarios, and timing diagrams. (Wikipedia-2, 2009)

The Diagram-79 is extracted from http://en.wikipedia.org/wiki/File:Restaurant-UML-SEQ.gif to show an example of the Sequence Diagram.
Diagram-79 - Sequence Diagram


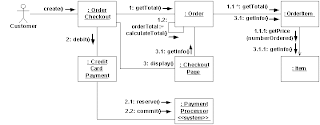
UML Collaboration Diagrams / communication diagrams like UML sequence diagrams, are used to explore the dynamic nature of your software. Collaboration diagrams show the message flow between objects in an OO application, and also imply the basic associations (relationships) between classes. Collaboration diagrams are often used to:
  • Provide a birds-eye view of a collection of collaborating objects, particularly within a real-time environment.
  • Allocate functionality to classes by exploring the behavioral aspects of a system.
  • Model the logic of the implementation of a complex operation, particularly one that interacts with a large number of other objects.
  • Explore the roles that objects take within a system, as well as the different relationships they are involved with when in those roles.
(Ambler-4, 2009)

The diagram-80 is to show the example of Collaboration Diagram. (from http://www.agilemodeling.com/style/collaborationDiagram.htm)
Diagram-80 - Collaboration Diagram


UML state machine diagrams, formerly called State Chart Diagrams in UML 1, depict the dynamic behavior of an entity based on its response to events, showing how the entity reacts to various events depending on the current state that it is in. Create a UML state machine diagram to explore the nature of a:
  • Explore the complex behavior of a class, actor, subsystem, or component.
  • Modeling real-time systems.
(Ambler-5, 2009)

The Diagram-81 shows the example of State Chart Diagram extracted from http://www.agilemodeling.com/style/stateChartDiagram.htm
Diagram-81 - State Chart Diagram


In UML, an Activity Diagram is used to display the sequence of activities. Activity diagrams show the workflow from a start point to the finish point detailing the many decision paths that exist in the progression of events contained in the activity. They may be used to detail situations where parallel processing may occur in the execution of some activities. Activity diagrams are useful for business modeling where they are used for detailing the processes involved in business activities. (Sparx, 2009)

An Example of an activity diagram is shown in the below Diagram-82 extracted from http://www.sparxsystems.com.au/resources/uml2_tutorial/uml2_activitydiagram.html
Diagram-82- Activity Diagram


A Component Diagram in the Unified Modeling Language, depicts how components are wired together to form larger components and or software systems. (Wikipedia-3, 2009)

The Diagram-83 is extracted from http://en.wikipedia.org/wiki/Component_diagram and is to show an example of Component Diagram.
Diagram-83 - Component Diagram


A UML2 Deployment Diagram depicts a static view of the run-time configuration of processing nodes and the components that run on those nodes. In other words, deployment diagrams show the hardware for your system, the software that is installed on that hardware, and the middleware used to connect the disparate machines to one another. You want to create a deployment diagram for applications that are deployed to several machines, for example a point-of-sales application running on a thin-client network computer which interacts with several internal servers behind your corporate firewall or a customer service system deployed using a web services architecture such as Microsoft’s .NET. Deployment diagrams can also be created to explore the architecture of embedded systems, showing how the hardware and software components work together. In short, you may want to consider creating a deployment diagram for all but the most trivial of systems. (Ambler-6, 2009)

The Diagram-84 is used to demonstrate the example of Deployment Diagram and is extracted from http://www.agilemodeling.com/artifacts/deploymentDiagram.htm
Diagram-84 - Deployment Diagram


Reference:

1. Ambler Scott W. (2006). "UML 2 Use Case Diagrams". Ambysoft Inc., Retrieved from URL - http://www.agilemodeling.com/artifacts/useCaseDiagram.htm
2. Ambler Scott W. (2006). "UML 2 Class Diagrams". Ambysoft Inc., Retrieved from URL - http://www.agilemodeling.com/artifacts/classDiagram.htm
3. Ambler Scott W. (2006). "UML 2 Sequence Diagrams". Ambysoft Inc., Retrieved from URL - http://www.agilemodeling.com/artifacts/sequenceDiagram.htm
4. Ambler Scott W. (2006). "UML 2 Communication Diagramming Guidelines". Ambysoft Inc., Retrieved from URL - http://www.agilemodeling.com/style/collaborationDiagram.htm
5. Ambler Scott W. (2006). "UML 2 State Machine Diagramming Guidelines". Ambysoft Inc., Retrieved from URL - http://www.agilemodeling.com/style/stateChartDiagram.htm
6. Ambler Scott W. (2006). "UML 2 Deployment Diagrams". Ambysoft Inc., Retrieved from URL - http://www.agilemodeling.com/artifacts/deploymentDiagram.htm
7. Sparx (2009). "Sparx Systems - UML 2 Tutorial - Activity Diagram". Sparx Systems Pty Ltd, Retrieved from URL - http://www.sparxsystems.com.au/resources/uml2_tutorial/uml2_activitydiagram.html
8. Wikipedia-1 (2009). "Class Diagram". Wikipedia The Free Encyclopedia, Retrieved from URL - http://en.wikipedia.org/wiki/Class_diagram
9. Wikipedia-2 (2009). "Sequence diagram". Wikipedia The Free Encyclopedia, Retrieved from URL - http://en.wikipedia.org/wiki/Sequence_diagram
10. Wikipedia-3 (2009). "Component Diagram". Wikipedia The Free Encyclopedia, Retrieved from URL - http://en.wikipedia.org/wiki/Component_diagram


Q4. Why is a Two-Phase commit protocol better than an One-Phase atomic commit protocol?

Answer:

First of all, let's see the definition of One-Phase atomic commit protocol and Two-Phase commit protocol.

One-Phase atomic commit protocol is that an elected co-ordinator tells all the other processes to perform the operation in question. (Cosh, 2009)
Two-Phase commit protocol is ...
  1. The coordinator sends a VOTE_REQUEST message to all group members.
  2. The group member returns VOTE_COMMIT if it can commit locally, otherwise VOTE_ABORT.
  3. All votes are collected by the coordinator. A GLOBAL_COMMIT is sent if all the group members voted to commit. If one group member voted to abort, a GLOBAL_ABORT is sent.
  4. The group members then COMMIT or ABORT based on the last message received from the coordinator.
(Cosh, 2009)

Two-Phase commit protocol is better than One-Phase atomic commit protocol because there is no way to tell the coordinator when a process cannot perform the operation (Cosh, 2009)

Reference:

1. Cosh Ken (2009). "Lecture 7 of ICS362 – Distributed Systems". Computer Programming I in the Computer Information Systems Department at Payap University, Retrieved from URL - http://www.kencosh.co.uk/cis/ics362/362L7.ppt


Q3. What is difference in loading balancing with traditional and transactional MOM, RPC and conversations?

Answer:

Message-oriented middleware (MOM) lets a service's consumers physically and temporally decouple from the service providers (see www.webmethods.com and http://www-306.ibm.com/software/integration/wmq/). Communication between service providers and their consumers is asynchronous, and they don't need to be available at the same time because they communicate by sending and receiving messages from designated message queues.
In contrast, Remote Procedure Call (RPC) is a synchronous method of requesting remote service execution. Consumers must suspend service execution until they receive a reply from the provider. (Menasce, 2005)
RPC is a protocol which allows a program running on one host to cause code to be executed on another host without the programmer needing to explicitly the code . RPC is an easy and popular paradigm for implementing the client-server model. An RPC is initiated by the caller (client) sending request message to a remote system (the server) to execute a certain procedure using arguments supplied. A result message is returned to the caller.
Message-Oriented Middleware (MOM), which is a specific class of middleware that supports the exchange of general-purpose messages in a distributed application environment. (Li, Gomez, Tran and Villar, 2008)

In terms of load balancing, MOM transfers messages across servers. If a server fails, then another server takes over for the message' transmission. This is the way MOM implements loading balancing.
On the other hand, RPC does not consider load balancing because Remote Procedure Call (RPC) is a client/serverRemote Procedure Call (RPC) is a protocol that one program can use to request a service from a program located in another computer in a network without having to understand network details. (Li, Gomez, Tran and Villar, 2008)
Put simply, RPC does not consider the access path so RPC does not consider load balancing.

Reference:

1. Menasce Daniel A. (2005). "Scaling the Web MOM vs. RPC: Communication Models for Distributed Applications". IEEE Computer Society in George Mason University, Retrieved from URL - http://cs.gmu.edu/~menasce/papers/IEEE-IC-MOM-RPC-MarchApril2005.pdf
2. Li Zongrui, Gomez Candido, Tran Peter and Villar Jose (2008). "Middleware". Faculty Resources of California State University, Retrieved from URL - http://www.calstatela.edu/faculty/nganesa/College%20Courses/Slide...are%20TPM%20and%20RPC.ppt


Q2. Describe a TP monitor environment. How can a TP monitor stop an operating system being overwhelmed?

Answer:

According to Jeri Edwards', a TP Monitor is "an OS for transaction processing". TP monitor does mainly two things extremely well. They are Process management and Transaction management.
They were originally introduced to run classes of applications that could service hundreds and sometimes thousands of clients. TP Monitors provide an OS - on top of existing OS - that connects in real time these thousands of humans with a pool of shared server processes. (ProgrammerWorld.NET, 2008)
TP monitors provide the greatest performance advantage over both MQ and RPCs. Of course, it depends on what you're doing. Several features of TP monitors, such as BEA's Tuxedo, IBM's CICS, and Microsoft Transaction Server (MTS), enhance performance as well as provide the ultimate in scalability.
When it comes to support for many clients and a high transaction processing load, nothing beats a good TP monitor. TP monitors perform such tricks as using queued input buffer to protect against peaks in the workload. If the load increases, the engine is able to press on without having an effect on response time. TP monitors can also use priority scheduling to prioritize messages and support server threads, thus saving on the overhead of heavyweight processes. Also, the load balancing mechanisms of TP monitors make sure that no one process takes on an excessive load.
TP monitors also provide queuing, routing, and messaging features, which let distributed application developers bypass the TP monitor's transactional features. Here is where you can assign priorities to classes of messages letting the higher priority messages receive server resources first. (Linthicum, 1998)

TP monitor can stop the operating system being overwhelming. That is, the real performance value is the TP monitor's load-balancing feature. Load balancing lets TP monitors respond gracefully to a barrage of transactions. An example is end-of-the-month processing. As the demands increase, the transaction manager launches more server processes to handle the load and kills (stop) processes that are no longer required. What's more, the manager is able to spread the processing load among the processes as the transaction requests occur. (Linthicum, 1998)

Reference:

1. ProgrammerWorld.NET (2008). "Networking Interview Questions and Answers". ProgrammerWorld.NET, Retrieved from URL - http://faq.programmerworld.net/networking/networking-interview-questions-answers.html
2. Linthicum David S. (1998). "Application Architect". DBMS Online - Middleware Performance, Retrieved from URL - http://www.dbmsmag.com/9808d07.html
3. Schussel George (2009). "Client/Server: Past, Present and Future". Retrieved from URL - http://www.dciexpo.com/geos/dbsejava.htm

Q1. Give a description in your own words of the ACID properites of a transaction.

Exercise 19: TP monitors and Transaction Protocols

Q1. Give a description in your own words of the ACID properties of a transaction.

Answer:

ACID properties of a transaction means Atomicity, Consistency, Isolation and Durability of a transaction.

Atomicity in (ACID) means the transaction have to be completed or remian the previous state. That is, for instance, in Oracle, the insert operation needs "commit" statement to add a new record. Else, we can use "rollback" statement to cancel the insert operation. We cannot save a single part of the transaction without all parts of transaction. We cannot ignore a single parts of transaction without all parts of transaction being ignored.

Consistency in (ACID) means that Data (Record) is not allowed to keep in a contradictory state and each transaction have to follow an integrity contraints. Intergrity contraints is the declaration of consistency rules. For example, I set that every employee record must have employee number in employee table and every manager must have at least one employee as a subordinate in manager table. If it is found that in the manager table manager does not have employee number and manager does not have subordinate employee, then the database
is not consistent.

Isolation in (ACID) means that each transcation is only allowed to operate independently. No simultaneous transactions can interfere with each other. If there is some intermediate results of one transaction, these results must be transparent to all other transactions. One transaction (namely, transaction-A) can be affected by other transactions only if transaction-A has been completed.

Durable in (ACID) means that once the transaction has been committed and saved, the transaction (record) must be kept permanently even if the database is crashed , restarted or failed. For instance, I insert a record in Teradata Database. After that, I reboot the UNIX and Teradata. When the system boots up again, the record is still there. Thus, Teradata Database is Durable.


29 Apr 2009

Exercise 18: Threading demonstration in Python

A simple demonstration of the threading module in Python that uses both a lock and semaphore to control concurrency is by Ted Herman at the University of Lowa. The code and sample output below are worth a look. Report your findings.

Answer:

I have copied the provided code and run the code on my laptop computer. The returned result is similar to the given result. The given result and my returned result are not the same exactly because the speed of the computers running the same code is different.

The code of the threaddemo.py simulates the lock and semaphore processing. threaddemo.py create 3 important variables. They are sema, mutex and running when numtasks limits the number of thread/task at 10. Variable (object) sema take 3 tasks to run at a time. When running the 3 tasks, Variable (object) mutex put a Read lock to the process of threading. After a wait, some tasks of the three tasks are completed, variable running keeps track on the completion of the tasks or threads. If some tasks of the three tasks are completed, variable (object) mutex release the read lock and new tasks of the remaining 7 are added and processed. Consequentially, the 10 tasks (threads) are done totally when 3 tasks are proceessed each time.

The threaddemo.py exactly simulates semaphore and locking.